Monday 30 March 2015

Do health authorities care about emergency department wait times?

Emergency rooms are places where, for the most part, people wait. The people who are really sick will see a doctor immediately but most people aren't really sick when they get to the ER. So they wait in the waiting room, they wait for x-rays, they wait for blood tests, they wait for medications. They wait for a long time and then they get angry and they get miserable. Staff people including doctors often don't help with these things either. The ER is designed to be efficient - to reach a medical decision without any frills. The doctors and nurses can be similarly efficient in their bedside manner. This is often for good reason - they usually have 15 other patients they need to assess and treat within the next hour or so and so they really can't stop to get your entire life story.

I worked 10 total weeks of shifts through four ERs in three major Canadian cities. I also did about two weeks of shifts in an emergency room in northern Manitoba during various family medicine rotations. I observed a couple things about how an ER functions over my ten plus weeks in these various emergency departments.  I am by no means an expert but from my perspective the ER accomplishes two major tasks. First, it deals with emergent, life threatening cases that require medical intervention (hence the name emergency department). This isn't just the typical "I got hit by a car" kind of emergency but it also includes conditions that may not be emergent but require some sort of specialist intervention urgently. 

As an example, I saw a case one time where a man had come in because of steadily increasing shortness of breath over a 6 week period. He was sitting comfortably in one of the stretcher bays when I examined him and looked perfectly fine. As ER docs like to say he was "in no acute distress" which often is code for "should probably not be in my ER". Nevertheless his history was concerning- he was losing weight and he had a long history of smoking. So we ordered a chest x-ray and lo and behold there was a giant white mass enveloping his upper left lung field. This was a man who needed to see a cancer specialist immediately.

This first role of the ER is to act as a conduit into the medical system. ER docs are the people who make the initial call about who needs to see what medical services and when. They stabilize patients, make a rough diagnosis and then send them to the service that needs to treat them. The ER makes sure that the guy who gets hit by a car is not going to die, they assess to see what bones are broken, and then they ship him upstairs to see an orthopaedic surgeon who sticks a metal rod in his leg. The guy with the lung mass is discharged after getting an order for a CT scan of his chest and a referral to a respiratory doctor the next day. People with severe abdominal pain are sent to see surgeons, stroke victims are sent to see neurologists and people with suicidal thoughts are sent to see psychiatrists.

This is the cool part of emergency medicine. Figuring out what is going on with sick people who haven't been seen by any other medical providers and stabilizing them if necessary. This is why emergency doctors go into emergency medicine. But the second role of an ER is way less cool. Whereas the first role is the stuff of television dramas the second role is like watching paint drying while listening to elevator music.

The alternate function that ERs fulfill is that of a glorified, twenty-four hour walk-in clinic. This means back pain, runny noses, medication refills, and sprained ankles. This is not to discount any of these legitimate health issues but it is to say that many people who are waiting in an ER are not the reason it gets its name.

The people who wait for hours are usually the ones who should see their family doctor but for a variety of reasons they come into the ER and sit and wait and then complain about the wait times. Its an issue thats been on the back burner for a while but flares every once in a while when some hack journalist, looking to earn a pulitzer, dredges up some sob story about a person who was stuck in the ER for seven hours and didn't even get their stubbed toe treated. And because most people in Canada have waited in an ER these stories resonate.

The standard medical system response to this is to put out press releases and interviews on how they're working to shorten ER wait times and make patients better off. There is a theory though that while they say all of these things, hospitals and regional health authorities (RHAs) don't actually care about shortening ER wait times all that much. 

This is a theory that's deeply rooted in political economy and its a pretty interesting one. RHAs know that their funding is dependent upon people lobbying the government for increases. The best way to create this political pressure is to make people angry and upset that they can't get good health care. So the RHAs will deliberately starve (or fund below the optimal level) the services that they know will put the most pressure on government. Everyone has been to the ER and everyone hates waiting in the ER and so that becomes the most visible place where RHAs can generate political pressure for governments to fund them at higher levels. They really don't care about ER wait times because reducing them would mean less political pressure and less overall funding, or so the theory goes. 

So how could one test this theory. The quick and dirty way to do this would be to see if RHAs with high wait times get more funding and when they do, do they then reduce ER wait times. Do they put their money where their mouth is?

To test this, I had to get data from a couple of sources. First I took wait time data from this CBC article which sources their data from a Canadian Institute for Health Information (CIHI) report that does not seem to exist anymore. If you've had any interaction with CIHI in any way this incompetence is not surprising. The data runs from the 2008/2009 to 2012/2013 fiscal years.

A couple of things about this data; first, the measure that the CBC article uses is the wait time of the 90th percentile.  This means that 90% of patients wait less time than this measure while 10% of them wait longer. It is also a measure of how long you are waiting before seeing a doctor. It does not include the amount of time afterwards for imaging or bloodwork or medical orders.

Further, this data is not a complete picture of Canadian RHA wait times. It includes all the RHAs of Ontario but beyond that the data gets spotty. There are a number of large centres that are included in the data though including Saskatoon, Regina, Winnipeg, Halifax, Vancouver, and Edmonton.

The second thing I collected was budget data from annual reports that each RHA in Canada file every year. They have all been taken from the websites of the RHAs and the measure that I use for all of the following is the total expenditures in an RHA over a given year. The collection of reports is available upon request.

To support this theory we need to do two things. First, we need to establish that RHAs look like they're using wait times to secure more funding. This would suggest they have an incentive to keep wait times high. Second, we need to establish that after they secure this funding it doesn't look like they use it to reduce their subsequent wait times. Then we can say that this theory is at least consistent with the facts.

First lets establish that RHAs with high wait times get more funding the year afterwards. Below is a plot of the change in overall expenditures in an RHA for the years of 2008/2009 to 2012/2013 versus the wait times in the year prior. As last years wait times increase there is a positive increase in the change in expenditures in an RHA. RHAs with higher wait times are getting more funding the next year. This is at least suggestive that RHAs are using long wait times to secure more health funding. For those in the know, a fixed-effects regression conditioning on the RHA also shows a positive relationship.


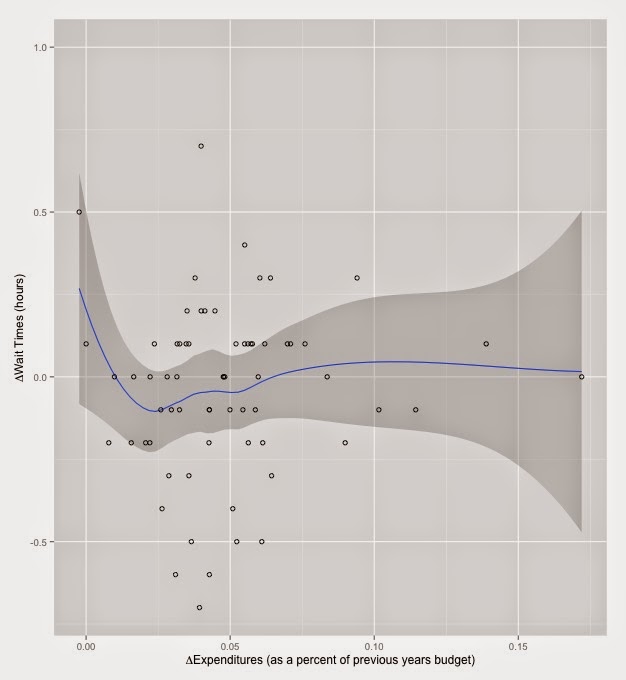
Now to make an argument that once the RHAs get this funding they don't reduce ER wait times with it. Below is a figure that graphs the change in expenditures versus the change in ER wait times. The relationship plotted is a LOESS regression (locally weighted scatterplot smoothing) and the dark grey area is the 95% confidence interval. Basically there is no relationship between changes in expenditures and changes in ER wait times. The exception is for a portion of the regression at about $30,000,000. I think this is likely due to chance rather than a real relationship.


But maybe this is the wrong relationship to be examining. This has no real regard for the size of the RHA and you would expect that very large RHAs would also have very large changes in funding simply because they are larger. An increase to the budget of Toronto's RHA is going to be larger than the increase to the budget of PEI's RHA. To try and control for this I've graphed the change in spending as a percent of the previous years budget (ie. (EXP_y1-EXP_y0)/EXP_y0). This will roughly remove overall size of the RHA (in expenditures) from being a confounder. Using this measure also shows little to no relationship between changes in expenditures and changes in wait times.


Maybe this is something that only applies in places where there are already high wait times. In RHAs that have high wait times do we see increases in funding translate into decreases in wait times? Using an arbitrary cut-off of RHAs that have wait times above 3.5 hours both fixed effects linear panel models and simple OLS models demonstrate no relationship between increases in funding and ER wait times in this subsample.

So it does seem that when an RHA has a longer wait time they get more funding. But when RHAs get more funding it doesn't seem like they use it to reduce ER wait times. Moreover, the places with high wait times that should be reducing wait times are not when they get more funding. This lends support to the RHAs don't care theory.

I doubt that this is something that would hold at any wait time level, especially very high ones. For example, the Grace hospital (in Winnipeg) has the longest wait times in the country at over 9 hours. Again, this doesn't count the time after seeing the doctor waiting in an ER. My guess is that this is a wait time that the Winnipeg RHA will not tolerate even if it means that they lose political pressure and associated funding bump. It does seem though that RHAs are willing to tolerate wait times of around three to five hours before emergency room patients will see an ER doctor.

The use of this measure by CIHI and the RHAs is also a textbook example of how to lie with statistics. Note that they do not use the total amount of time that a person waits in the emergency room. They use time to see a doctor. The real time that a person spends in the emergency room is, without a doubt, far longer than what is documented here. I suspect the reason why this benchmark was agreed upon was to artificially reduce the wait times reported.  This induces perverse incentives at the level of health care provider as pressure will be on doctors to reduce the time of first contact with a patient but not necessarily the overall wait time.

Finally, from a health systems perspective, if you buy this theory then the incentive is for RHAs to reduce the funding to ERs below an optimal level. They get more funding if they deliberately starve the emergency department. How should governments ameliorate this perverse incentive? One such strategy would be based on tying funding to actual future performance outcomes. If governments promised additional RHA funding bonuses based upon reductions in ER wait times this would provide the additional money that RHAs want if they actually get on top of the ER waiting problem. This would make it in an RHA's best interest to cut their ER wait times.


Saturday 14 March 2015

How are you most likely to get your limbs lopped off?

Let me tell you a tale of two amputations. When I was on my anesthesia rotation I had the unfortunate experience of meeting a man, younger than me, who had been working with a piece of heavy machinery. He got too close to the intake and his arm was caught in the blades. It had been mangled into a pulp. We had been consulted about a week after this happened because he required some pain control before his third surgery. The surgeons had been slowly chopping off pieces in an attempt to preserve some of the limb but because it had been so badly damaged he didn't really have any function in whatever remained of the lump of meat that was his arm. I heard later that they had eventually taken the whole thing off.

On a separate rotation through an infectious disease clinic I had another amputation experience. There was an older lady from up north who had severely uncontrolled diabetes and had got an infection in her big toe. The attending doctor immediately recommended an amputation of that toe. Luckily, his friend, the vascular surgeon, was just across the hall running a vascular surgery clinic and so they decided it could all be done right there in the room under local anaesthetic. Snip snip - in 30 minutes I went from seeing a patient to seeing a toeless patient.

I've seen a couple of other amputations as well but these stick out because they are pretty typical examples of how you would lose a limb. Whenever anyone thinks of an amputation they usually think of the first guy: a mechanical accident affecting someone young. From my very brief medicine career, amputations seem to be much more like the second story here. Somebody has a longstanding condition that causes him or her so much pain or so much neurologic damage that it eventually needs the Marie Antoinette treatment. Nevertheless, for some reason, people think of amputations as events that occur among young, fit people in their prime in traumatic circumstances. So, what does the average person at risk for an amputation look like in Canada?

For all of this I use data from the Discharge Abstract Database, which documents all of the patients who enter and exit hospitals in Canada. This covers the time period from 2009 to 2012 and has information on their stay length, medical condition, and location. One caveat is that because of data sharing agreements, the public use datafile does not include any hospitals in Quebec or BC. It's also difficult to draw inferences about amputations in the territories because they don't do a lot of surgery and they'll often medevac patients who need intensive care to southern facilities. In addition, because it's the public use data file I don't really know what's been amputated, just that something has been amputated. 

So first some descriptives. There were at least 1,219 amputations in Canada over the 2009 to 2012 period. This is an underestimate as there is an additional category of diagnosis that I exclude because it also includes orthopaedic procedures to repair broken arms as well as arm amputations. The category is denoted "Resection/amputation/fixation of upper limb except shoulder/hand". It's likely this category is mostly broken bone repairs but it does also likely include some arm amputations, which are not counted in the 1,219. In terms of sex, males are much more likely to be the person having the amputation: over 63% of all patients getting amputations are men. In terms of the type of surgery performed, 63% of amputations were emergent or urgent whereas 36% were elective. There's a pretty even split of persons discharged home (50%) and to long-term care or rehab facilities (45%), but 4.5% died at some point during their stay. 

But going back to our examples, how do the differences in those two stories relate to amputation rate? First lets examine age.


This graph shows two peaks in amputation rates by age. One peak is at the age of our first example: younger people (basically teens). The second peak is in older people (60-64 year olds).  Ignore the peak in people who are 80 and older - it's an artefact from collapsing all people over that age into one category rather than evaluating 5 year tranches. 

Also in line with the two stories is the cause of the amputations. There are only two broad diagnoses classes that I can observe when it comes to amputation; they are diagnoses related to musculoskeletal issues and cardiovascular/vascular issues. Amputations as a result of musculoskeletal (MSK) injuries - most likely traumatic injuries - are fairly evenly distributed across the age spectrum. Amputations because of vascular and other blood supply related conditions are really, almost exclusively an older occurrence. So MSK injuries disproportionately cause more amputations among the young, whereas even though there are a lot of older patients who have MSK injuries, they are much more likely to suffer from blood supply related conditions.


So we have an idea about average age of amputation. The likelihood of getting one increases as you get older, but there's a peak in younger persons, probably due to trauma. You can think of young amputations as something caused by labour force participation, accidents and other random events like the young man in our story. Vascular amputations though are more likely related to lifestyle factors: eating, smoking, etc. (this is a little simplistic - amputations due to frostbite would also probably qualify as vascular and aging itself is associated with these issues even in people who are fairly healthy). With this basic idea in mind, we can make some inferences about the healthiness of populations at a provincial level as well as the exposure that they have to accidents in the labour force. Where are people unhealthy and where are people getting into accidents? 

With the reminder that I have no data on Quebec or BC, it seems like Nova Scotia is the place where you are most likely to get your limbs chopped off for whatever reason. This was surprising to me because all the surgeons I've ever talked to in Winnipeg have boasted about the ability of their service to cut off arms and legs because of how many amputations they see. Manitoba places a distant third after Nova Scotia and Newfoundland and Labrador. These three are followed by our prairie brethren in Saskatchewan. Ontario, New Brunswick, and Alberta all have the same approximate rate, and PEI rounds out the bottom of the group. I guess nobody loses arms in the potato fields.


The fact that two maritime provinces are tops in the amputation league table leads me to suspect that this has something to do with fishing but I don't know. Maybe that's just the stereotype I have of maritimers. If we look into the breakdown of MSK and vascular injuries though, this would also suggest that MSK related-accidents are driving amputations in Nova Scotia in particular.


If we make the assumption that MSK injuries are correlated to labour market accidents or trauma, it kind of makes sense that the top two provinces are Nova Scotia and Alberta. Nova Scotia has the fishery, but also, on a cursory glance at Wikipedia, a lot of mining and resource-sector jobs. Alberta has the tar sands. Both of these economies have a lot of hungry-for-appendages-type machinery. Here, Manitoba comes in third likely because of the farming sector.


In contrast though, Newfoundlanders seem to lose their legs to vascular disorders. If vascular injuries are correlated with lots of lifestyle choices that are bad for long-run health (smoking, eating McDonalds, no exercise) then, based on this, Newfoundland and Labrador is probably the unhealthiest place in Canada. Nova Scotia doesn't do much better on this measure though coming in a close second. Manitoba doesn't even make the top three, being beat out by Saskatchewan.

So the person who is most at risk of an amputation is a male in his 60s who is probably suffering from poor blood supply or diabetic infection to a limb because of poor lifestyle factors. He's probably from eastern Canada (at least on a population-adjusted basis), likely Newfoundland and Labrador.

With all of this in mind, why do people think of the young guy crushed in a thresher rather than the old lady with diabetes when they think about amputations? The latter seems much more typical of the amputations that occur in Canada. As a sort-of economist I'll throw out one possible reason: people value the former person's story more than the latter. They sympathize with somebody who has had to undergo a lot of trauma in a very short order. I would go so far as to suggest that some of this is even valuing a young limb more than an old limb. A young person who has a leg cut off has to go for the rest of his or her life without it, whereas an older person won't be using that leg for very much longer anyway. Charities definitely capitalize on this sentiment. It's never your granny hobbling around in a WarAmps commercial - it's always the cute kid with the prosthetic. Would you donate more if it was the other way around?

Is that right or is that ageism? I'm not sure. But I've got at least forty years to smoke and eat McDonalds before I need to make that decision.


Wednesday 4 March 2015

How much more coffee did I drink on my internal medicine rotation?

Internal medicine is much like an abusive relationship. There's a lot of fear and anger and sleepless nights during the whole experience but after you leave them you always look back with a weird amount of positivity. 

For a lot of medical school, students are treated (with pretty good reason) like barely functioning, hung-over hooligans who shouldn't be given a bag of sand to look after much less a living patient. Not so on your third year internal medicine rotation. Your patients are your responsibility, and nobody second guesses your management plans except to tweak it or give suggestions. For myself, it was the first time I threw on the big boy stethoscope. You feel like a real doctor. Besides that you learn an incredible amount and you work with some of the smartest residents and attending doctors in medicine. This really makes all the difference in an intense situation like an internal medicine ward - I had three very intelligent and patient senior residents who taught me a lot. Same goes for my three attending physicians. 

On the other hand though, my internal medicine rotation was the most grinding, gruelling marathon in which I've ever participated. Looking back I think I easily worked 100+ hours per week. My day started at 645AM when I would come in to Health Sciences Centre in Winnipeg to see my patients, check labs, make a plan, etc. We would round on patients (walk around, say hello, examine them, make orders, call consultants) until about 1130 and then in the afternoon we would write notes, do procedures and get some teaching from the senior medical resident. Sign-out rounds (sitting down and talking about what happened during the day for each patient and talking about any patients coming to the ward that night) were at 5PM and then anything else that hadn't been accomplished would be completed after that. 

630PM days were pretty normal unless you were on call in which case, saddle up, because you're here for the next 14ish hours. One person from the team would always stay on the ward overnight and for me it was always a special experience. When on call at Health Sciences, your night consisted of making sure no one died, pronouncing people who died, admitting new patients to the ward, writing orders for patients who needed medication changes, getting called to an imminently dying patient and if you were lucky maybe an hour or two of sleep. You then got to go home after presenting your patients on rounds the next morning and slept for the entire day (your post-call day). Wash, rinse and repeat the next day. Call, for me, was about every four days (on average - an important distinction).

Because of this most of my classmates, and myself, look back at these six weeks with an almost Stockholm Syndrome-like reverence. It's the most immersive learning experience I have ever had (and an overall positive one) but because the above is pretty typical of internal medicine residencies, it doesn't have a reputation for being a job with a balanced lifestyle. I once had a senior internal doctor tell me verbatim "nobody gives a shit about how well-rounded their doctor is, so study more", which seems harsh but if I was sick and in the hospital I would want this guy looking after me, no questions. Internal medicine docs have a reputation for being exceptionally smart and being great problem solvers, but they don't have a lot of hobbies.

Now let me backtrack a bit to be clear for those without a medical background. Internal medicine doctors essentially run every major hospital in any city in Canada - they're experts in diagnosis and treatment of diseases. They don't do surgical stuff but if you get admitted to hospital for something like a heart attack you see a cardiologist who is an internal medicine doctor.  Other internal doctors include those who do infectious disease, lungs, kidneys etc. - these are all internal medicine sub-specialists. Consultants are extremely important in patient care but to be fair to the internal medicine people, rotations on sub-specialty consulting services are much less intense from a time-commitment standpoint than CTU.

In Winnipeg, on the ground care is delivered by general internal medicine doctors through a general medicine ward or clinical teaching unit (CTU - medicine loves abbreviations). Any specialty involvement is as a consultant to the CTU team, with some exceptions (cardiology for example has its own ward at one of the major hospitals in Winnipeg). Medical students in third year are embedded as part of a team that runs the CTU, which means that they take care of patients directly, and I was one of these medical students about 8 months ago. 

But back to the question that started this post. CTU is a long, grinding experience. As a guy who needs to have coffee to avoid drooling in front of people on a normal day, the 26 hours that I would sometimes go without sleep really upped the ante on my caffeine addiction. I don't think my experience was all that atypical either. I would often hear my other classmates commiserate about what cup they were on that day when we all met for some group teaching session on our weekly half day off. So how bad (or good?) did my coffee drinking get during my CTU rotation?

To answer this question, I had to do the one thing every medical student hates to do more than anything else. I had to look at my Royal Bank of Canada credit card statement. The great thing about banking with RBC is that along with monstrous, soul-crushing debt, it provides me the ability to download expenditure data into a CSV file through my online banking. They're also kind enough to mark all expenditures on the statements as negative just to remind you that you owe them this money. A $2.00 expenditure is not just marked as $2.00, but as -$2.00.

Because I never had any time to sleep, I definitely didn't have the time to go get cash from an ATM and all of my coffees were bought via credit or debit card. From this I can pick out all the dates that I went to the Starbucks or Tim Hortons or Subway or the hospital cafeteria in a four-month period around the time I was on  the CTU at Health Sciences. Because I also know how much I spent, I can also tell about what size the coffee was. I have converted all of this into a rough estimate of the  daily caffeine content that I purchased using nutritional information from menus on company websites. I also had to make some guesses about how much coffee I purchased because of some bills that included snacks or other purchases that didn't exactly line up to an amount that would direct me to a coffee size. For these instances I've tried to give a conservative estimate of the amount of caffeine I consumed. 

The important thing in posing this question though, is how my coffee intake changed with regard to a comparator. I can easily tell you what my coffee intake was over my time on CTU, but if I was already drinking the same amount before the rotation, it doesn't really demonstrate anything about the intensity of CTU. To use some lingo I picked up in medical school, my "treatment" period then is my time on CTU and what a treatment it was. My "control" period is just before and just after my CTU rotation. In total this comprises the period of June until the end of September.

To give some context, the three weeks prior to CTU I did my rotation through Children's Hospital in Winnipeg on one of the paediatrics wards, which in itself was a whole bag of laughs. But this was at least similar to the ward work at Health Sciences except with less call. The period after CTU I went on vacation (thanks for taking me Mom!) for two weeks and then did four weeks of emergency medicine at a community hospital in Winnipeg. The emergency medicine schedule is usually an 8 or 9 hour shift and then you're done - any patients still around you pass on to the next ER doctor. While they both have their own idiosyncrasies, for the purposes of this exercise we'll call them typical of my coffee routine during medical school outside of CTU. 

So lots of writing but lets latte the stats do the talking. During the four month period I bought coffee 84 times. Of these, 49 purchases were during the CTU or treatment period whereas 35 were in the control period. While only comprising 6 of the 16 weeks in the time period my CTU rotation was responsible for 58% of the total coffee purchases in this timeframe. Comparing the percentage of all of my purchases (coffee or otherwise) in the treatment period shows a similar effect that CTU had on my life. Coffee comprised 66% of all transactions I made during this treatment period. In contrast coffee comprised 35% of all of my purchases during the control period. All very suggestive about CTU's effect.

In terms of coffee loyalty, this data reveals me as a true Starbucks man. Over the whole period, the vast, vast majority of coffee I bought was from Starbucks. Over 73% of my total coffee purchases were at Starbucks, with Subway coming in a distant second at 10.7%, and really that's only because I bought a sandwich at the same time and was too lazy to make a separate trip to Starbucks. For those not in the know, Guildy's and Pedway (now defunct) are/were two cafeteria-style restaurants at Health Sciences Centre.

If we confine examination to the treatment period on CTU, Starbucks purchases rise to over 95% of my total coffee purchases. This sharp increase was because all of these other coffee places couldn't really compete with Starbucks for scheduling reasons. Starbucks was open all night and everyone else wasn't, and that's when I got the majority of my coffee on CTU. I would've drank week-old coffee grounds strained through a worn hairnet on some of those nights so how much my slavish loyalty says about Starbucks is debatable. I also have no idea how doctors function on CTUs without a 24-hour coffee shop nearby.


Slavish devotion to Starbucks in one picture?

Moving onto a more in-depth analysis of how much coffee I consumed above my baseline level because of CTU, below is the time-series of total coffee consumption during the four months. There are two figures here, and the second is more confusing than the first but they're essentially the same graph. The first figure is a time series of my total caffeine consumption purchased during the four-month period. This also has a gap when I went on vacation (and didn't pay for anything - thanks again Mom!).

The second figure is a time series of each rotation with the origin being the initial day I was on the rotation. Day 0 is the first day I began each rotation and for example, day 40 is the last day I spent on CTU (a total of six weeks with some gaps for weekends). This allows comparisons of how my caffeine intake changed as each rotation progressed.

Time series of caffeine intake

Caffeine intake by rotation where day 0 is the first day on rotation


Now what can we say about each of the control periods on emergency medicine and paediatrics? Statistically they are exactly the same. I drank an average of 325mg of purchased caffeine each day while I was on paediatrics wards. After CTU, on emergency medicine I consumed about 300mg of caffeine per day.

Where it gets interesting is during the treatment period. What's particularly interesting to me about these two graphs is that you can literally pick out the days that I was on call for the CTU. The spikes in use of caffeine correspond to the evenings I was on call. The saw-tooth pattern is a result of getting a lot of coffee the night I was on call and then a couple on the morning that I was post call. I would go for a coffee at about 0300 or 0400 and then again just before rounds at 0800. After this I would go home, have greasy post-call breakfast, and sleep. This would mean that on these post-call days I would have maybe two coffees to try and get myself through rounds in the morning.

The trend in caffeine intake also is indicative of how sleep-deprived I was during my CTU rotation. During my first two or three weeks I was probably on call every two to three days, which made for a giant, increasing sleep deficit. The escalating caffeine doses during these first three weeks demonstrates this. Notably, neither my paediatrics wards or emergency medicine rotation display similar behaviour. Then in week three or four of CTU I had a glorious period when I didn't have any call. I caught up on sleep and reduced my coffee intake significantly. In the final two weeks, I had significantly less coffee intake except for my final day when I bought a giant group-sized Starbucks coffee lug to share with the nursing and ward staff as a thank-you. I drank about 5 cups of coffee of this mostly because I was post-call on my last day before vacation (thanks Mom!) and was trying to ride the euphoria.

Explaining this relative decrease in caffeine consumption during weeks 5 and 6 may be related to how well CTU in Winnipeg teaches you to do an internal medicine history and physical. If I remember correctly, I managed to get more sleep during this period because I was able to recognize what I was looking for with the brief information I was given as the patient was transferred to the ward. This is graphical evidence, in coffee form, of exactly what internal medicine docs want medical students to get out of a CTU rotation. They want to teach you to be thorough but efficient when you deal with complex patients. You pick this up after a couple weeks of the CTU routine.

Overall, this analysis would suggest that I consumed 678mg of caffeine per day on my CTU rotation. This is significantly above the control periods that I discussed earlier. The standard deviation of my caffeine consumption went up significantly as well, suggesting that not only did I increase my caffeine use, but CTU also caused my intake to become much more spread out. On days when I consumed purchased caffeine I consumed a lot, but on days when I didn't, I consumed way less caffeine. During my CTU I approximately doubled my daily caffeine intake from about 300mg to 678mg of caffeine. A Starbucks "Grande" coffee has approximately 330mg of caffeine in it, so I was taking in an additional one of these each day because of CTU. 

Its important to remember though that the total caffeine intake on CTU that's shown here is likely an underestimate of my total intake. It doesn't take into account any times that I brought in a travel mug and had more coffee than the normal "Grande" that I usually purchased. In a pathetic attempt to limit how much coffee I was consuming at one point I consciously tried to buy Starbucks Refreshers to avoid coffee. These have some caffeine that is not accounted for here. In addition it must be noted this does not include any coffee I brought from home and I did this a lot when I was on CTU. I never thought I'd be desperate enough to drink powdered coffee packaged in Africa, but then I never had been on a CTU before this year.

The perceptive among my three readers will also note another fact about these time-series. This is essentially a graph of my 2014 summer slipping away in cups of coffee. I began paediatrics wards on June 1st and ended internal medicine wards on August 1st.

I often feel a twinge of regret looking back on a summer that I spent indoors on hospital wards but, baby, if you just take me back, I'll forget everything internal medicine.

Sunday 1 March 2015

What does the market for drugs in Winnipeg look like?

As the inaugural post on this blog I thought I'd start out with a hit. Or a rip. Or a toke. Or whatever you want to call it.

Illegal drugs are fascinating to me because they are one of those things that are ubiquitous but no one gets into specifics about. Because they are subject to so much regulation and so much police interdiction nobody really wants to talk to strangers about what drugs they did and when. Moreover, unlike toasters or cars we can't observe any direct economic data about drugs because drug dealers don't submit tax forms to the Canada Revenue Agency. That data is so poor is unfortunate from a medical perspective because drug abuse is a concern for long-run health of individuals and comes with a host of mental, infectious, and other health problems. 

This presents a pretty important problem to people who want to observe these transactions and understand some of the decisions behind using illegal drugs. In Canada there is one major survey that looks at drug use - the Canadian Alcohol and Drug Use Monitoring Survey (CADUMS). Unfortunately the methodology of it is less than ideal. The sample they survey is not necessarily random because its performed by telephone, doesn't include people who only have cell phones, and has a pretty bad response rate at about 40-50% depending on province. When 50-60% of the people you try to talk to either hang up or don't pick up in the first place, you have to be worried about the data accuracy. 

More importantly the survey they conduct likely misses out on the people who are most affected by drug policies like interdiction - the least wealthy, the homeless, etc. (to their credit the CADUMS people acknowledge all of these issues). If they even have a land line in the first place, they are usually less likely to respond to a bunch of strangers phoning from a call centre to ask them about what drugs they use - they have more important stuff to do for that 25 minutes. 

Where can you get data on drugs where all of the people who are contacted have to give their details? Like the Doobie Brothers suggest, we have to take it to the streets. On the streets, when a police officer approaches you about drugs, participation is not voluntary. And when a police officer compels you to participate in their version of a drug survey they usually get to keep what your holding.

The Winnipeg Police Service (WPS) is no exception to this and they were kind enough to provide, through an access to information request, all drug related seizures in the city of Winnipeg from February 2009 to May 2014. This includes any drugs that were picked up incidentally but over 90% of the drugs seized were through busts. If we take this number of seizures to be correlated well with popularity of drug then we can ascertain the relative amount that Winnipeggers use types of drugs.

After bashing the CADUMS data for a couple paragraphs its important to emphasize that this seizure data has pretty significant limitations as well. The first thing to keep in mind is that this exercise equates drug use with drug seizures. While I do think that there is correlation between the drug seizure rate and the drug use rate in Winnipeg using this metric probably underestimates drugs use among certain populations and among certain drug users. The police are probably less likely to hassle someone in suburban Winnipeg than downtown Winnipeg, which means that this data isn't necessarily representative of drug users but representative of the drug users in contact with the police. Again, I think theres correlation but some skepticism is certainly in order.

These caveats notwithstanding lets light up some of these statistics. First, what drugs do Winnipeggers like to do? Its no surprise that the top drug thats consumed in Winnipeg is marijuana. Over the 5 year period approximately 9500 seizures of marijuana were made in Winnipeg. Cocaine and crack cocaine round out the top three. Prescription drugs, a major perennial headache in primary care clinics and emergency rooms comes in fourth in front of meth and MDMA.


The popularity of drug type by number of seizures - February 2009 to May 2014

Noticeable are the drugs not on this list. Heroin, by this data, is not a big drug of choice in Winnipeg. Same goes for opium. In total these two drugs were seized only 11 times over the five year period. This may be due to where these drugs are produced and how they are shipped. Heroin and opium are mostly produced in Asia - although Mexico is also a big player. Transport is usually by ship and heroin usually winds up in port cities - Vancouver being the obvious seaside city with a major population of heroin users.

While not as well-recognized as many other illegal drugs in circulation prescription drugs rank as fairly highly used in Winnipeg - moreover this metric likely under represents the true number of recreational prescription drug users in Winnipeg. Most doctors have been in the position in an ER or clinic where the patient seems like they're really milking their back pain for those T3s. I've been there. Its difficult to turn patients down and the vast majority of people who come into medical facilities for prescription drugs do so for legitimate medical purposes and not recreation. Nobody likes denying somebody medication for pain when they genuinely need it, so screening becomes a big headache.

Having a prescription for these drugs essentially gives a free pass if you ever get into it with law enforcement though, which is a major difference from other drugs - a prescription is not something generally given to use cocaine or MDMA. This gives some medical cover that may mean fewer busts of people who have prescriptions for painkillers but use them recreationally. Despite this, seizures do occur and painkillers comprise the top five prescription drugs busted in Winnipeg.


The popularity of prescription drug type in Winnipeg - February 2009 to May 2014

If we take a look at the time trends of use of the top four drug categories several things also leap out. First, marijuana has been the primary drug in Winnipeg throughout these last five years. It's strong and steady and it's got significant market share. In the crack cocaine market though there seems to be a switch that occurs late 2010 or early 2011 when crack cocaine was seized at a much lower rate than earlier. By the eyeball test, this coincides with a period when cocaine became seized at a higher rate. Maybe crack dealers became better at avoiding police. Maybe the demand side of the market began substituting towards cocaine and away from crack. Maybe there was a major single dealer of crack that got taken down the police and cocaine stepped in to replace the crack void. It's also possible my eyes are playing tricks on me and theres no actual relationship here. I'm not sure.


Timelines of number of seizures per day by top four drug categories


Where do Winnipeggers do drugs? Geography in Winnipeg plays a big part in determining drug use. Keep in mind for the following that the geographic points (each point indicating a seizure) are approximations and the true busts are within 2-3 blocks. 

For the most part the neighbourhoods that see the most drug busts are in the north end and downtown of Winnipeg. These are notoriously rough areas in Winnipeg for high crime and poverty and the distribution of drug use dissipates as you move into the suburbs. It's likely that there are three major factors influencing the picture of this distribution, especially with regard to the high level of drug busts in the north end. 1) People in the north end and downtown do more drugs than other places for a variety of reasons; 2) there is a higher population density in the downtown core and in the north end which by volume correlates to higher seizures; and 3) there is a higher police presence for crime-related reasons in the north end and downtown and that means more eyes to make more seizures. The inability to tease out these effects is one of the major aforementioned problems with this data. 


The geographic distribution of drugs busts through Winnipeg


Examining the geographic centre of the drug trade in Winnipeg (by average latitude and longitude of the busts) shows stability in the five year period of the data. 2014 is a bit of an outlier but probably because there is only four months worth of data. These geographic drug centres are again, in the north end of downtown Winnipeg right where the giant cluster of seizures is on the above map. 


The geographic centre of the drug trade (by average latitude and longitude) in Winnipeg by year


In Winnipeg, as mentioned above, poverty clusters around the downtown core and just north of downtown. Neighbourhoods become more affluent as the distance from the geographic centre of drug trade increases with some exceptions. Graphing how spread out the prevalence of drug use is from this geographic drug centre can tell us a little about how neighbourhood affluence relates to use. Below is a plot of the distributions of drug seizures based upon distance from the drug geographic centre of Winnipeg. The origin is this area around the north end and the tails of the graph are the probability of a drug bust close to the suburbs. For all four drugs, use is highly concentrated in the downtown and north end, but the spread differs for each drug in significant ways.


The distributions of drug use by distance away from the centre of drug trade in Winnipeg


The first noticeable thing is that crack cocaine is highly concentrated in the north end and downtown perhaps because it is a much more affordable drug. Marijuana is much more spread out reflecting the popularity of the drug throughout the city.  Cocaine has a similar spread that reflects its higher popularity among the suburbs. 

The distribution of prescription drugs is very interesting though. While there is a significant amount of use around the north end, there is a small bump in the prescription drug busts as you get very far from the geographic drug centre of Winnipeg. This may reflect the popularity of prescription drugs in the more affluent areas of Winnipeg and relatively higher levels of prescription drug use have been documented among wealthier populations. 

Finally, when do Winnipeggers like to do their drugs? If we assume seizures are more likely around the time of use, several trends emerge dependent on the type of drug. Theres a big trough in drug seizures in the early morning times for all drugs. Nobody apparently does drugs between 0300 and 0800. This may also have something to do with enforcement - I know that if I were a police officer, cracking skulls in the wee hours before breakfast would be the last of my priorities. If you were to take that as one of the reasons explaining these distributions, the time to do drugs without police interference would be between 0300 and 0800.

Moving onto specifics, marijuana use builds to a plateau just after lunch time and remains constant for the rest of the day. Prescription drugs are used in the early afternoon and then tail off as the night goes on. Cocaine use builds through the day until the 1800 to midnight period when people need it to keep the party going through the night. Crack cocaine users have a bimodal distribution and seem to use around lunch and then again around 2000. 


When do people like doing drugs?


There's a lot to get out of this data. Timing, geography and taste all play roles in Winnipeg's drug market. As someone in the medical field, the fact that prescription drugs are the fourth most used drug according to this metric also highlights medicine's role in addiction. Diversion is a major problem that the medical field hasn't really got a handle on and it's difficult because a lot of patients sometimes need medical opiates - screening for appropriate use is very difficult. That this data also likely underestimates prescription drug use makes me wonder if it isn't further up the rankings of drug use in Winnipeg. Some recent evidence has suggested that prescription drugs are a larger reason for ER visits and deaths than all other illegal drugs combined so this isn't a small problem.

Perhaps the biggest pro of this dataset is that the people who are included here are the people who are most affected by drug policy (almost tautologically). They are concentrated in the poorest parts of Winnipeg. While some of the interdiction observed in this data certainly targets the suppliers of drugs, most of these busts seem small time and seem more likely to be users. In looking at all of the marijuana busts for example, over 95% seems to be quantities seized under 40 grams and over 75% of these busts are less than 20 grams. The median amount for a bust is just over 6 grams.

It's often difficult for me to understand the logic of harassing individuals over their use of substances like marijuana or crack or cocaine. Alcohol and tobacco are vices our society accepts and regards as health problems if individuals abuse them - why not these drugs?  Moreover, if this data is any indication, a high number of users in Winnipeg seem to have enough socioeconomic problems without the further inconvenience of having their doors kicked down in a vice operation.